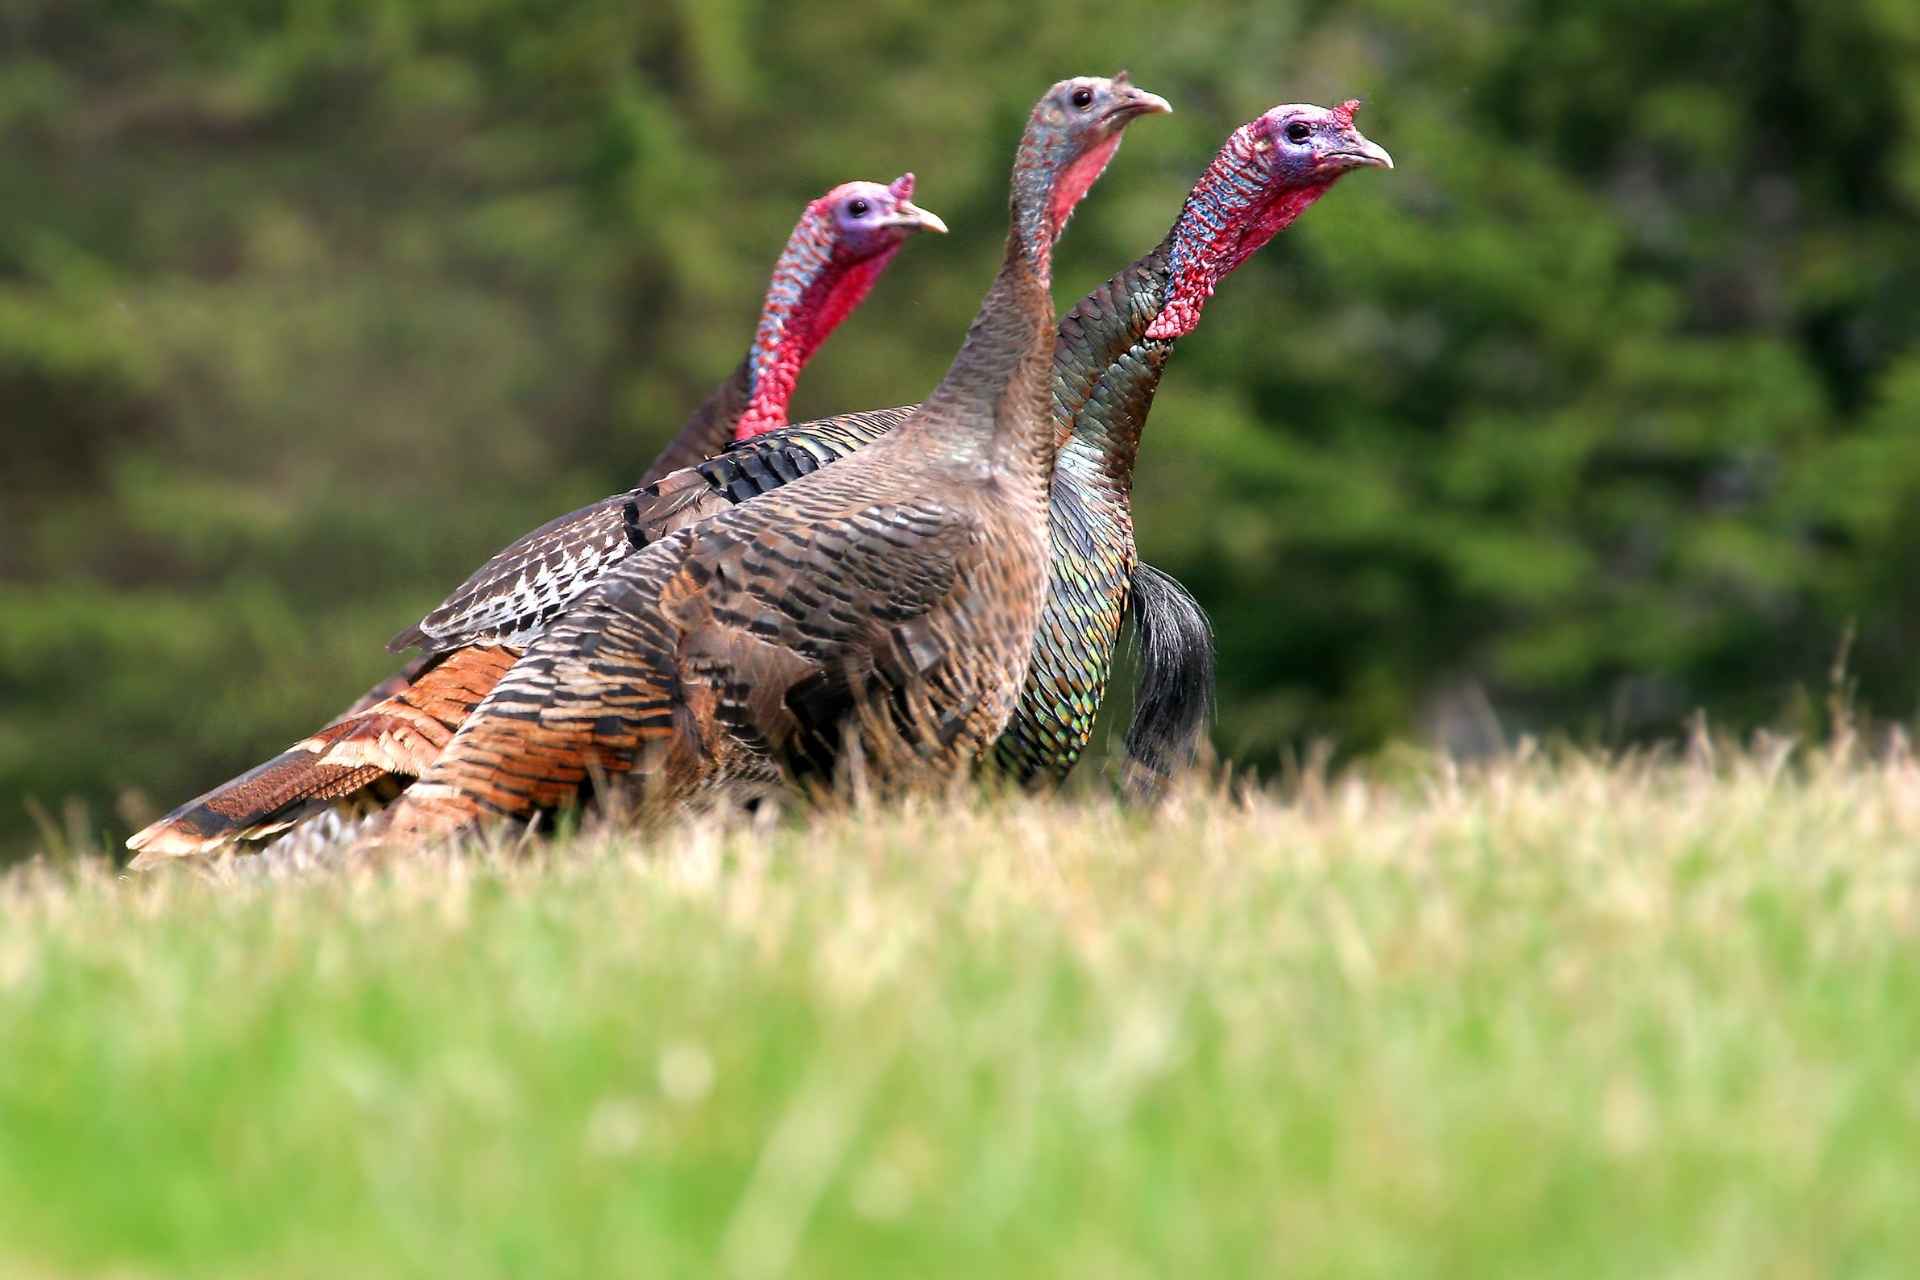
SOUTH CHARLESTON, W.VA. — According to preliminary data released by the West Virginia Division of Natural Resources (WVDNR), hunters harvested 10,134 turkeys during the state’s spring gobbler season.
The 2021 harvest is 10.43 percent lower than the 2020 harvest, when hunters took 11,320 birds. The 2021 harvest is 10.32 percent below the five-year average of 11,300 and 2.93 percent below the 10-year average of 10,449.
“Even though our turkey population appears relatively stable, we will always experience ebbs and flows in population abundance and accordingly our harvest,” said Mike Peters, wild turkey project leader for WVDNR.
WVDNR field staff observed relatively low turkey production in 2019 compared to the previous five years. Peters said most turkeys harvested during the spring season are 2 years old and that this year’s harvest reflects the lower production in 2019.
2021 Spring Turkey Season Harvest Numbers
Districts 2 and 4 reported a slight increase in the number of birds harvested during the 2021 spring season compared to last year’s totals. The remaining districts harvested fewer birds. District 1 harvested the most birds (2,298), followed by District 6 (1,930), District 5 (1,701), District 4 (1,673), District 3 (1,484) and District 2 (1,048).
The top five counties with the highest turkey harvest were Mason (364), Preston (343), Jackson (323), Kanawha (299) and Harrison (271) counties.
During the two-day youth season, youth hunters harvested 487 turkeys, 328 of which were taken on Saturday with the remaining 159 taken on Sunday. The youth harvest made up 5.7 percent of the season’s total harvest. Youth numbers are included in the table below with county totals.
Spring Turkey Season Harvest Numbers (2017-2021)
County 2017 2018 2019 2020 2021
Barbour 204 250 202 234 163
Brooke 100 174 118 131 134
Hancock 106 87 109 146 190
Harrison 328 440 347 339 271
Marion 257 330 298 289 226
Marshall 256 417 311 296 252
Monongalia 267 346 263 270 235
Ohio 113 145 145 130 119
Preston 475 555 455 434 343
Taylor 135 189 142 146 102
Tucker 97 89 102 86 87
Wetzel 244 396 270 248 176
Dist. 1 Subtotal 2,582 3,418 2,762 2,749 2,298
Berkeley 147 162 141 151 131
Grant 145 160 140 124 146
Hampshire 184 166 203 176 209
Hardy 132 151 142 123 137
Jefferson 115 115 125 121 115
Mineral 133 148 121 113 114
Morgan 64 65 83 93 58
Pendleton 112 112 112 111 138
Dist. 2 Subtotal 1,032 1,079 1,067 1,012 1,048
Braxton 209 307 257 234 183
Clay 120 142 102 102 123
Lewis 249 289 233 250 225
Nicholas 311 287 260 265 219
Pocahontas 142 113 155 109 146
Randolph 247 207 258 214 225
Upshur 302 335 297 255 260
Webster 151 129 100 93 103
Dist. 3 Subtotal 1,731 1,809 1,662 1,522 1,484
Fayette 278 247 257 290 254
Greenbrier 269 225 254 248 259
McDowell 177 132 105 122 118
Mercer 192 150 129 174 194
Monroe 192 183 231 201 256
Raleigh 280 213 205 212 218
Summers 209 170 158 182 194
Wyoming 262 197 182 190 180
Dist. 4 Subtotal 1,859 1,517 1,521 1,619 1,673
Boone 157 125 132 169 119
Cabell 176 125 147 182 127
Kanawha 320 308 296 310 299
Lincoln 229 158 173 218 174
Logan 165 157 141 172 151
Mason 448 469 465 457 364
Mingo 143 106 118 147 119
Putnam 268 235 236 287 222
Wayne 186 129 132 190 126
Dist. 5 Subtotal 2,092 1,812 1,840 2,132 1,701
Calhoun 164 190 164 147 154
Doddridge 160 216 178 198 143
Gilmer 143 170 142 140 133
Jackson 408 460 447 404 323
Pleasants 88 122 124 109 97
Ritchie 264 327 285 283 252
Roane 256 280 258 252 244
Tyler 181 250 217 209 157
Wirt 205 230 186 200 157
Wood 380 407 362 344 270
Dist. 6 Subtotal 2,249 2,652 2,363 2,286 1,930
State Total 11,545 12,287 11,215 11,320 10,134


