Using data and numbers, a West Virginia University statistician is exploring new methods that could predict and model extreme patterns in weather events, financial turmoil and pollution levels.
Mihyun Kim, assistant professor of statistics in the WVU Eberly College of Arts and Sciences School of Mathematical and Data Sciences, earned funding from the National Science Foundation to develop statistical tools that will address those issues.
“This research is about more than just numbers,” Kim said. “It’s about using advanced statistical tools to better understand and prepare for extreme events that can have profound impacts on our lives and economy.”
Kim’s research aims to answer questions such as “How likely is it for location A to experience heavy precipitation patterns similar to those observed in location B on the same day?” or “During a stock market crisis, do returns on different sectors exhibit similar extreme daily trajectories?”
Currently, there’s a lack of appropriate statistical tools for analyzing extreme behavior in high-resolution, curve-type data, Kim said. Functional data, a set of curves, are observed across diverse disciplines, such as daily temperature, precipitation, pollution concentration patterns and intraday stock return curves. This type of data is not a single value but rather a whole curve or function, Kim explained.
“For example, instead of just noting how much it rained today, functional data would record how the rain changed every minute of the day,” Kim said. “So, if we have minute-by-minute data, we can create a smooth line that shows exactly how the rain went up and down throughout the day.”
“Similarly, in finance, rather than only recording the closing price of a stock each day, functional data tracks how the stock price moves all day long. This way, we get a complete picture of what happened throughout the day, not just one number at the end. It helps us understand the full story of how things change over time.”
Kim will aim to create new and innovative methods for accurately modeling and understanding extreme patterns found in these curve-type data. A key component of this research will be the creation of a tool called the “extremal correlation coefficient,” which will measure how likely extreme curves in data exhibit similar patterns simultaneously.
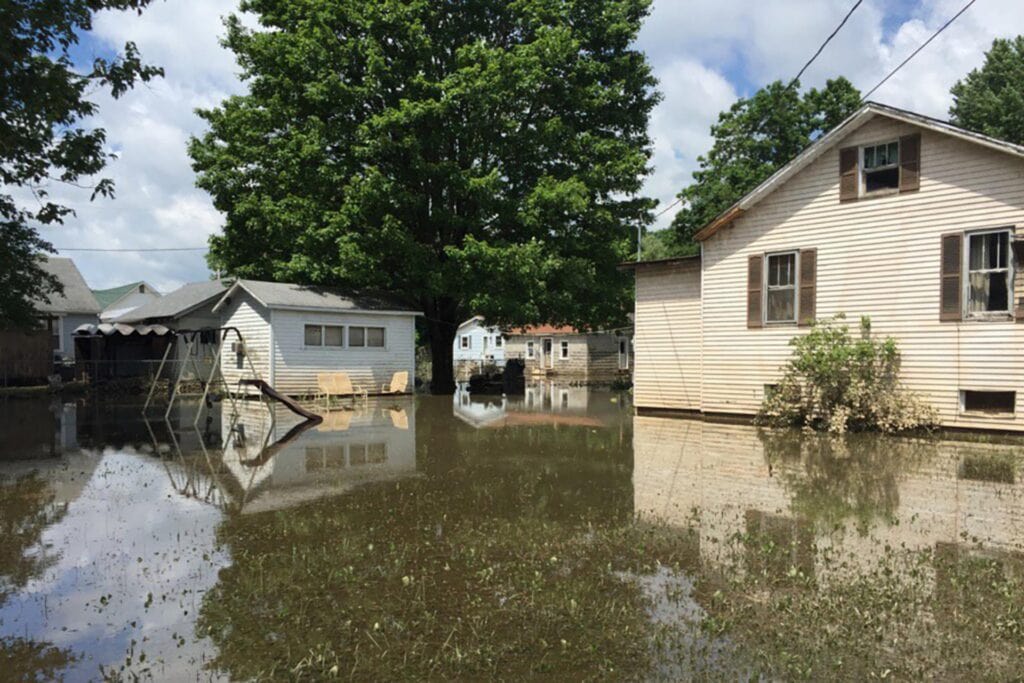
This research could play a critical role in regions with diverse topographies, such as West Virginia where mountainous terrain with creeks and rivers is susceptible to flash flooding.
“The 2016 flash floods in West Virginia, a one-in-1,000-year event, caused 23 fatalities and an estimated $1 billion in damages,” Kim said. “The mountainous topology across the state led to varied flood patterns, concentrating risks and damages in certain areas. I believe that my risk assessment tools can help enable better preparedness and response strategies, ultimately protecting lives and property.”
The risk assessment tools are adaptable to other mountainous states beyond West Virginia and applicable to various disciplines requiring risk management, Kim said. She is hopeful government agencies will use the tools for disaster preparedness and response.
Additionally, her research will assist financial institutions in managing risk exposure more effectively.
“Given that millions of Americans have savings in retirement plans, accurately quantifying the risk of catastrophic financial losses is essential,” she said. “By providing precise measurements of risks associated with extreme market conditions, this project supports national efforts to safeguard economic security.”
The project will involve undergraduate and graduate students in statistics and mathematics research.
To amplify impact, Kim plans to collaborate with researchers from the environmental science, economics and engineering fields at WVU. She also hopes to connect with government agencies and organizations to gain access to real-world data and opportunities to further address these issues.


